
A Spectrum of Natural Texts:
Measurements of their Lexical Demand Levels
Donald P.
Hayes
Department of Sociology
Cornell University
1. The concept of a text's lexical demand
If they are to understand texts, readers and listeners must have a substantial prior knowledge base of a language's principal and secondary terms, their meanings and uses, the domains to which they refer, the significance of their different grammatically inflected forms, and the major exceptions to the rules. Since our knowledge mainly develops out of our language experiences, the breadth and depth of that knowledge is, in part, conditional on the resources contained in the texts we encounter. National and international tests of verbal attainment and knowledge have long been used to estimate the extent to which verbal knowledge has been developed by individuals. Here, the attention shifts from the reader to the text itself: what language resources do texts offer or require of the reader? Does the text make demands that exceed the readers' knowledge (as do most scientific papers), is it well-suited to its audience, or does it make few demands? "Lexical demand" refers to the extent of these text resources - ranging from very demanding to undemanding. The "metric," named LexD for short, is based on one of the better established generalizations in education: the broader and deeper the verbal knowledge base, the greater the text comprehension, and the greater and more accurate memory of the text. Best known is a strong positive correlation between verbal knowledge and general academic attainment. By implication, if American schoolbooks were made less demanding throughout the twentieth century (as the evidence suggests), then the verbal knowledge bases of college-bound students (when tested by the SAT-Verbal sub-tests) should have declined and remained low. It has declined, and it has remained low.
2. Calculating a text's lexical demand level
A specific text's level of lexical demand can be estimated by comparing its relative use of word "types" (i.e., terms with unique orthography) against the relative use of those same word types in an English model lexicon. Did the sample text overuse each such word type relative to the Model, or make less use of it than in the Model? Akin to calculating chi square, QLEX software repeats this calculation for every unique word type used in the sample text. The net score is the text's LexD score, 0.0 if the sample text's use of words is indistinguishable from that in the Model; negative if the text is skewed toward the common words in the Model; and positive when the text is skewed toward the uncommon and rare words in the Model. The metric was developed in 1980 to meet the normal scientific standards for precision, validity and reliability. Its statistical distribution across a wide range of natural texts is described in Table 1 (below). The spectrum of sample texts is drawn from print, radio/TV broadcasts, and speech. At the high positive extreme of texts are scientific and technical papers taken from professional journals. The middle of the distribution includes sample texts from 84 English-language newspapers published throughout the world between 1665 and 2002. Among the least demanding natural texts are spontaneous conversations between adults and with children. The precision and validation for the principal Lex measures are reported in articles in Nature (Hayes, 1992) and in AERJ (Hayes, Wolfer, and Wolfe, 1996).
3. The model lexicon for English words
A core feature of the Standard Model is its pattern of word choice, which is linear when all the types in the English Mode are arrayed by their relative use in the New York Times (1996-2002), a corpus of 585 million words in every non-duplicated article. The most heavily used word type was the - which alone accounted for 6.2% of all the tokens used. The 24 most common word types, all grammatical words, alone accounted for a third of all words in texts. That leaves over a million "content" types to account for the remaining two-thirds. In this Standard Model, this linearity can extend beyond the first 50,000 most common types. When all the words used in the Times corpus are arranged along the X-axis according to their relative frequency of usage, and their cumulative contribution to all words used plotted on the Y-axis, this distribution approximates a statistical distribution found throughout nature and in large language corpora. Beyond the linearity found among commonly used words, all these distributions have extraordinarily long tails. This same linearity and ranking of word choice occurs among different corpora (New York Times and the American Heritage Dictionary corpora), in word frequencies in two separate years of Le Monde articles, and in two sets of year-long issues of Swedish newspapers. Not only are their distributions approximately linear, but their ranking of terms is also very similar (r = 0.99), suggesting powerful constraints on word and domain choice.
4. Two illustrative analyses
Figures 1 and 2 are graphic representation of lexical demand analyses. In Figure 1, samples were taken from articles published in 1989 in Cell, a highly technical scientific journal.
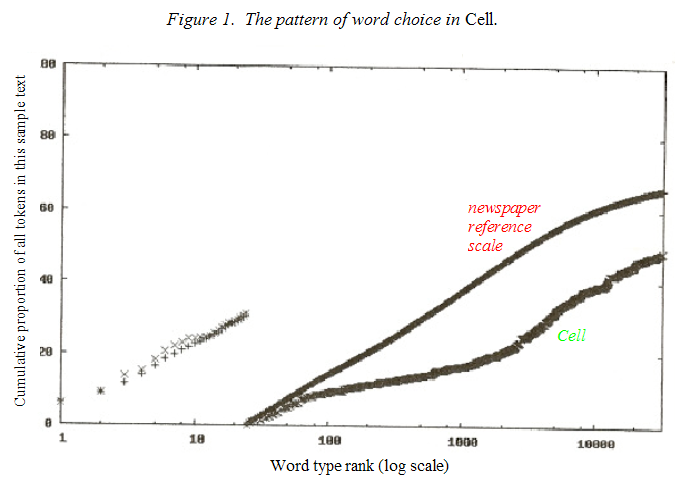
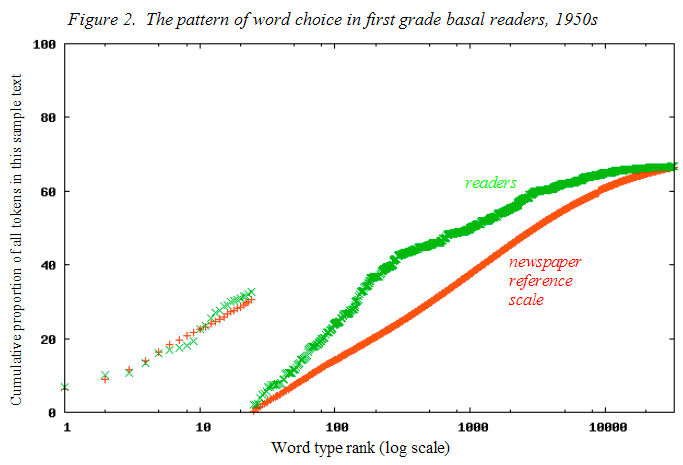
In Figure 2, the sample texts were drawn from over two dozen first grade readers published in the United States in the 1950s. On each graph, one line is close to linear, reflecting the pattern of word choice in the Standard Model. This pattern of calculations and comparisons is the same one used in all lexical analyses. The second line on each graph is the cumulative word frequency distribution for the sample text, after its types are arrayed according to the ranking in the Standard Model. From this analysis, Lex provides two measurements. One measure, called LexGram, describes the extent of the discrepancy in the usage for the 24 major grammatical types versus that in the Model. The other measure, called LexD, describes the discrepancy in usage for all content word types (those at rank 25 and above) between the sample text and the Model .
The feature these graphs highlight is their differential use of words: their skew toward or away from the level of usage in the Standard Model. The authors of the Cell articles skewed their choice of words away from the common content terms, while the publishers of American first grade readers sharply skewed their texts toward the common words, beyond their relative usage in the Standard Model. In tracking American schoolbooks since 1896 with this procedure, LexD shows that this reduction in demand occurred early in the 20th century and happened again in the 1950-1970s. This coincides with the reduction in verbal abilities by college-bound Americans on the SAT-Verbal test and on international testing at those points.
Several statistical properties for each text are reported. For this analysis, the most important measure is LexD - the lexical demand level of a sample text, i.e., the level of demand a text makes on the reader or listener's knowledge base. Every text is first edited to a common transcription standard (which excludes proper names, Arabic numerals, uncommon foreign terms, equations, etc.). Then the text is analyzed by QLEX 6.0. Included among the measurements are the use made of the 24 most common word-types; the total number of terms used, the number of word types, the date of the sample text, its source (TV, speech or print), and its median sentence length (in words). These LexD and related measurements were developed by the author in 1980; that software was used in an empirical challenge to the 'motherese' hypothesis then current in psycholinguistics (with M. Ahrens, 1982). The current program (QLEX 6.0), is the most comprehensive, accurate and best validated measure of lexical demand. It too is on the Web and is free.
5. The spectrum of lexical demand across all natural texts (Table 1)
A subset of nearly 7000 natural texts has been analyzed thus far. The purpose of this analysis is to establish the full range of LexD scores, the kinds of text in which those scores are to be expected, and to aid in establishing LexD's validity. The range in this sample is wide (+47 to -54), with the great majority negative and most texts below LEX = -30. Today's newspapers operate in a narrow range around LexD 0.0 and have remained in that range for over a hundred years. Newspapers represent a reasonable level of adult reading, making 0.0 an appropriate benchmark for all comparisons. By that standard, the school readers used in middle schools today seldom reach LexD = 0.0, whereas nationwide, students in the 1930s used texts which often were set at more demanding levels than newspapers before World War II.
Table 1. A Spectrum of Natural Texts: Printed, Spoken and
Broadcast
LexD - |
Freq./mil. |
Cum. % |
Cum. % |
Median |
N tokens |
LexD - |
|
| Cell - main articles 1994 | 47 |
38 |
31.0 |
48.7 |
21 |
1017 |
-1.2 |
| Nature - main articles 1994 | 40 |
60 |
30.3 |
50.6 |
22 |
2664 |
-1.1 |
| Science - main articles 1994 | 29 |
69 |
31.4 |
56.8 |
24 |
1821 |
-2.5 |
| New England J. Medicine - articles 1990 | 25 |
82 |
32.0 |
58.3 |
24 |
2020 |
-3.6 |
| Intellectual works - Derrida, Lacan... | 24 |
156 |
35.9 |
58.1 |
20 |
27984 |
-4.8 |
| U.S. high school science texts n=8 | 19 |
112 |
34.8 |
58.9 |
17 |
30072 |
-5.3 |
| Watson & Crick DNA in Nature 1958 | 18 |
120 |
36.7 |
53.8 |
19 |
829 |
-6.3 |
| National Geographic 1982 | 12 |
112 |
30.7 |
64.0 |
17 |
1023 |
-1.4 |
| Discover 1995 | 12 |
125 |
32.4 |
62.4 |
20 |
2192 |
-2.5 |
| Scientific American 1996 | 11 |
119 |
30.9 |
63.6 |
19 |
1391 |
-1.6 |
| McGuffy Reader - 6th grade 1896 | 8 |
167 |
35.2 |
59.8 |
23 |
3652 |
-3.2 |
| Time magazine 1994 | 7 |
157 |
33.8 |
62.5 |
21 |
1036 |
-2.7 |
| Revised King James Bible | 7 |
228 |
37.7 |
58.3 |
24 |
1048 |
-7.4 |
| Newspapers - Int. English lang. 2003 n = 26 | 4 |
168 |
35.5 |
62.3 |
19 |
52027 |
-4.3 |
| New Yorker 1994 | -1 |
182 |
34.6 |
63.8 |
15 |
1981 |
-2.1 |
| TV - NOVA - science program 1995 | -2 |
215 |
33.4 |
63.7 |
14 |
1014 |
-0.5 |
| Top 20 magazines, US, late 1980s | -2 |
195 |
30.7 |
65.4 |
14 |
16730 |
0.0 |
| New York Times - 2003 | -2 |
190 |
35.5 |
62.7 |
21 |
1838 |
-4.8 |
| SAT Verbal Reasoning Test - 1995 | -4 |
218 |
30.8 |
65.7 |
20 |
2666 |
0.4 |
| 6th grade mean reader - 2000 | -7 |
257 |
31.3 |
65.5 |
12 |
7114 |
0.3 |
| Sports Illustrated 1994 | -7 |
283 |
33.3 |
64.1 |
13 |
1054 |
-1.3 |
| GB - middle school leisure books 10-14 n = 23 | -7 |
305 |
32.7 |
63.9 |
11 |
255519 |
-0.4 |
| Harry Potter; 1st, 2nd, 3rd in series | -10 |
298 |
30.7 |
66.2 |
10 |
8469 |
2.5 |
| Books - fiction, popular with adults n = 31 | -10 |
324 |
31.8 |
64.9 |
10 |
32919 |
-0.1 |
| High school required English literature n = 38 | -10 |
324 |
31.8 |
64.8 |
9 |
86697 |
0.4 |
| Books parents read to pre-schoolers n = 15 | -11 |
330 |
31.9 |
65.0 |
8 |
32260 |
0.0 |
| Magazines for adolescents late 1980s n = 11 | -13 |
314 |
30.6 |
66.6 |
12 |
19643 |
0.9 |
| US elem. sch. leisure books 9-12 n = 92 | -13 |
324 |
30.6 |
66.4 |
9 |
96805 |
1.0 |
| Shakespeare plays: spoken text only n = 37 | -16 |
360 |
27.1 |
67.8 |
5 |
804170 |
5.3 |
| IRS instructions for Form 1040 - 1994 | -20 |
210 |
26.7 |
71.4 |
16 |
1016 |
0.3 |
| Comic books - GB and US n = 40 | -20 |
330 |
26.5 |
70.2 |
6 |
41497 |
4.0 |
| 1st grade readers in US 1950s n = 10 | -27 |
562 |
32.5 |
66.6 |
6 |
7489 |
-0.5 |
| TV - cartoon shows n = 24 | -28 |
411 |
24.0 |
72.4 |
6 |
23712 |
5.5 |
| Lyrics from pop. music top 40 n = 52 | -28 |
389 |
24.3 |
72.3 |
10 |
19885 |
4.7 |
| President to his Chief of Staff on 3-14-73 | -37 |
621 |
30.6 |
68.7 |
7 |
4734 |
1.3 |
| TV - series popular w/ children 1980s n = 33 | -39 |
509 |
23.7 |
74.2 |
6 |
38077 |
6.3 |
| TV - preschoolers: Mr. Rogers/Sesame Street | -39 |
562 |
24.8 |
73.7 |
6 |
2700 |
5.1 |
| TV - series popular w/ adults 1980s n = 44 | -40 |
562 |
24.8 |
73.3 |
6 |
48164 |
5.8 |
| Mother -> child 21 mo. old, n = 32 | -42 |
571 |
22.9 |
75.3 |
3 |
8184 |
8.4 |
| Mother -> child 60 mo. old, n = 32 | -45 |
574 |
23.6 |
74.8 |
4 |
25318 |
7.9 |
| Mother -> child 42 mo. old, n = 30 | -46 |
593 |
22.7 |
75.4 |
3 |
11333 |
8.3 |
| Adult to adult spont. conversation n = 28 | -47 |
613 |
24.7 |
73.9 |
5 |
33372 |
6.7 |
| Children -> mothers: 42 mo. old, n = 30 | -48 |
605 |
22.9 |
75.3 |
3 |
16133 |
7.9 |
| Obstet. nurses to newborns: n = 5 | -54 |
636 |
20.5 |
78.1 |
4 |
12228 |
9.9 |
References
Hayes, D. P., Wolfer, L. T. and Wolfe, M. F. 1996. "Schoolbook Simplification and its Relation to the Decline in SAT-verbal Scores." American Educational Research Journal 33 (2): 498-508. [download preprint version]
Hayes, D. P. 1992. "The Growing Inaccessibility of Science." Nature 356: 739-740. [download preprint version]
Hayes, D. P. and Ahrens, M. G. 1988. "Vocabulary Simplification for Children: A Case of 'Motherese.'" Journal of Child Language 15: 395-410.